· Fact Lease
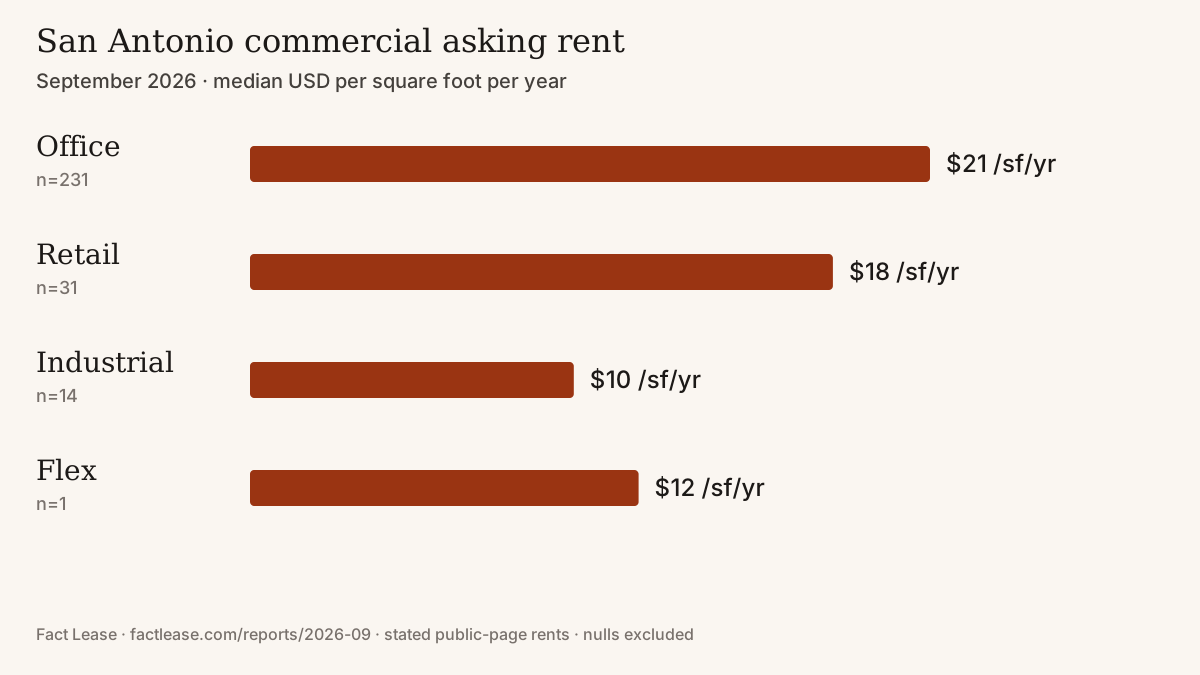
The September 2026 asking-rent snapshot puts the San Antonio citywide median at $21 per square foot per year (n=416). That n is stated readings that convert to dollars per square foot per year. The snapshot is https://factlease.com/reports/2026-09. The chart is https://factlease.com/reports/2026-09.svg.
Fact Lease tracks San Antonio commercial asking rents over time. San Antonio Lease Ledger is the alternate name of the same publication. It is not a broker. A null base rent is left out of every median; null does not mean zero. Nothing on this page is proof that a suite is available.
Published readings in this window are dated 2026-09-23. The observation window is 2026-09-01 through 2026-09-30, UTC. A date is the day a public page was read, not a lease start. 1991 suites have a reading in the window. 582 of those state a base rent. The citywide n of 416 is the count of stated readings that convert to dollars per square foot per year after 24 duplicate readings were collapsed. 108 stated rents stay outside every median because the unit could not be used.
Unit: dollars per square foot per year. Each n is the count of stated readings that convert. Use type not stated stays in the citywide median.
| Asset class | Median | n | Min–max |
|---|---|---|---|
| Office | $21 | 231 | $0.28–$3,000 |
| Retail | $18 | 31 | $9–$30 |
| Industrial | $10 | 14 | $6–$20 |
| Flex | $12 | 1 | $12–$12 |
| Use type not stated | $19 | 139 | $3.93–$350.65 |
Compare a proposal that is already in dollars per square foot per year with its class row in the table. The citywide $21 is the middle of every converted reading, including use type not stated.
Flex is $12 per square foot per year (n=1, from $12 to $12). That is one stated reading. It is not a flex market sample.
Use type not stated is $19 per square foot per year (n=139, from $3.93 to $350.65). Those readings stay in the citywide median. They are not moved onto office, retail, industrial, or flex.
3 normalized readings are above $200 per square foot per year, and 1 is below $1 per square foot per year. They stay in the median because the stated fields convert. The median is not the mean, so a single extreme reading does not set it.
Readings that state a monthly rent and no area stay in a per-month median: office $450 per month (n=9); use type not stated $3,750 per month (n=6). They are not divided into a per-square-foot rate. Readings that state a per-square-foot figure and do not say year or month stay out of the per-year median: office $17.50 per square foot, period not stated (n=11); retail $2 per square foot, period not stated (n=1); use type not stated $18 per square foot, period not stated (n=7). If a proposal uses one of those units, read that cohort on the snapshot instead of folding it into the citywide per-year median.
The largest postal-code row is office 78228 at $21 per square foot per year (n=122). A postal code is listed on the snapshot when at least 5 normalized readings share it inside one asset class. One building with many suites can move that row. The snapshot does not name a submarket.
Every published reading in this window is dated 2026-09-23. This is one observation date. No earlier month is filled in to draw a trend.
These medians are asking rents printed on public pages. They are not closed transactions and not effective rents.
The cohort tables for monthly rents and for per-square-foot rents with no period are on the snapshot. This note does not convert them.
Fact Lease is not leaseledgerapp.com accounting software.