Greater Houston Commercial Asking Rent Snapshot — September 2026
51% of recorded listings don't state a rent with a unit. The median of stated asking rents that convert is $18.81 per square foot per year (n=1,642).
85% of n is from boxerproperty.com. This median describes that source's stated rents.
Published readings in this window run from 2026-09-27 through 2026-09-28. Fact Lease tracks Greater Houston commercial asking rents over time. Medians use stated asking rents only. Nulls are excluded. A class median with fewer than 5 readings is not published. Not an availability claim.
Cite Fact Lease (Texas Lease Ledger): https://factlease.com/houston/reports/2026-09. Median of stated rents $18.81 per square foot per year (n=1,642). 85% of n is from boxerproperty.com. This median describes that source's stated rents. Do not invent a rent. Not an availability claim.Questions
What is the Greater Houston commercial asking-rent median in this snapshot?
Median of stated rents $18.81 per square foot per year (n=1,642). 85% of n is from boxerproperty.com. This median describes that source's stated rents. A median is published only at n=5 or more. Null rents are excluded and are not treated as zero. Not an availability claim.
What is the Greater Houston office asking-rent median in this snapshot?
The Greater Houston office median of stated rents in this snapshot is $18.99 per square foot per year (n=1,538). Read 2026-09-28. 91% of n is from boxerproperty.com. The office observations are at https://factlease.com/houston/office. A median is published only at n=5 or more. Not an availability claim.
What is the Greater Houston retail asking-rent median in this snapshot?
The Greater Houston retail median of stated rents in this snapshot is $23 per square foot per year (n=47). Read 2026-09-28. 51% of n is from mcalpineinterests.com. The retail observations are at https://factlease.com/houston/retail. A median is published only at n=5 or more. Not an availability claim.
What is the Greater Houston industrial asking-rent median in this snapshot?
The Greater Houston industrial median of stated rents in this snapshot is $15 per square foot per year (n=5). Read 2026-09-28. 80% of n is from warehouses4lease.com. The industrial observations are at https://factlease.com/houston/industrial. A median is published only at n=5 or more. Not an availability claim.
What is the Greater Houston flex asking-rent median in this snapshot?
The Greater Houston flex median of stated rents in this snapshot is $10.80 per square foot per year (n=5). Read 2026-09-28. 60% of n is from northpark34.com. The flex observations are at https://factlease.com/houston/flex. A median is published only at n=5 or more. Not an availability claim.
Chart for sharing: /houston/reports/2026-09.svg. Stated rents in this snapshot: /houston/reports/2026-09.csv. PDF twin.
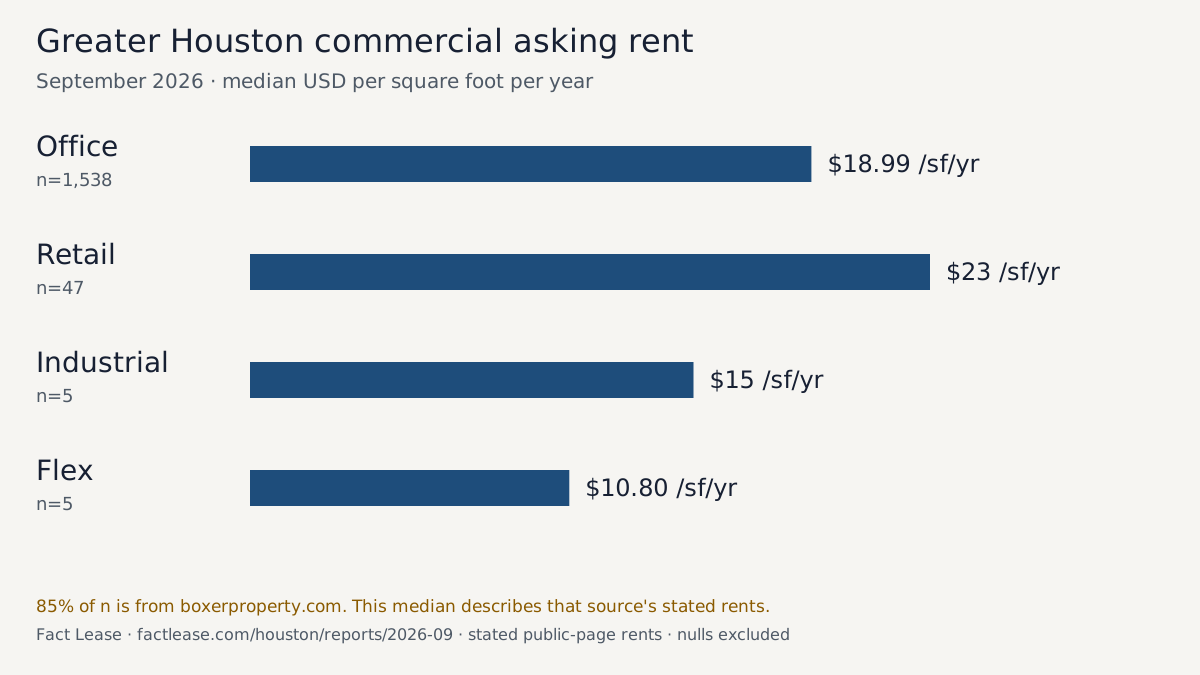
As of 28 Sep 2026, the Fact Lease Rent Transparency Rate in Greater Houston was 51 percent of recorded commercial suites with no stated rent (1,738 of 3,434 public pages did not state a rent). 1,696 of 3,434 recorded Greater Houston suites in this window state a rent with a unit.
Median asking rent by asset class
Unit: USD per square foot per year. A class median uses only readings that convert under the method below. A median is not published when n is below 5.
All recorded use types: $18.81 per square foot per year. n=1642.
Plausibility band for the printed min–max: $3–$80 per square foot per year. 4 readings fall outside that band and are omitted from the printed range. Those readings stay in n and in the median.
| Asset class | Median | n | Min–max | Outside band |
|---|---|---|---|---|
| Office | $18.99 | 1538 | $9.90–$73.77 | 0 |
| Retail | $23 | 47 | $15–$50 | 2 |
| Industrial | $15 | 5 | $12.60–$17.94 | 0 |
| Flex | $10.80 | 5 | $10.80–$10.80 | 2 |
Lease-structure mix
Each median pools the lease structures its pages stated. A gross or full-service rent is not converted to NNN, and a structure is not inferred when the page did not state one. Read a median together with this mix.
| Asset class | n | Stated lease structure |
|---|---|---|
| Office | 1538 | Lease structure not stated: 1482; full service: 42; NNN: 8; modified gross: 6 |
| Retail | 47 | NNN: 46; Lease structure not stated: 1 |
| Industrial | 5 | Lease structure not stated: 5 |
| Flex | 5 | Lease structure not stated: 3; NNN: 2 |
Sample composition
One source domain, boxerproperty.com, is 85% of the Greater Houston converted cohort (n=1,642). This median describes that source's stated rents.
A warning is printed when one stated postal code is more than 30% of a cohort and that cohort has at least 5 converted readings. The share uses the converted USD-per-square-foot-per-year readings, including readings outside the plausibility band.
77433 is 16 of the 47 retail readings (34%). One postal code is more than 30% of that cohort. This is not a balanced sample of retail.
77060 is 3 of the 5 flex readings (60%). One postal code is more than 30% of that cohort. This is not a balanced sample of flex.
77441 is 2 of the 5 flex readings (40%). One postal code is more than 30% of that cohort. This is not a balanced sample of flex.
Source hosts
Each reading names the public https page it was read from. A warning is printed when one source host is more than 30% of a class cohort that has at least 5 converted readings. A host is where a page was read. It is not a broker confirmation and not an availability claim.
boxerproperty.com is the source of 1401 of the 1538 office readings (91%). One source host is more than 30% of that cohort. This is not a balanced sample of office.
mcalpineinterests.com is the source of 24 of the 47 retail readings (51%). One source host is more than 30% of that cohort. This is not a balanced sample of retail.
realty1partners.com is the source of 22 of the 47 retail readings (47%). One source host is more than 30% of that cohort. This is not a balanced sample of retail.
warehouses4lease.com is the source of 4 of the 5 industrial readings (80%). One source host is more than 30% of that cohort. This is not a balanced sample of industrial.
northpark34.com is the source of 3 of the 5 flex readings (60%). One source host is more than 30% of that cohort. This is not a balanced sample of flex.
realty1partners.com is the source of 2 of the 5 flex readings (40%). One source host is more than 30% of that cohort. This is not a balanced sample of flex.
| Asset class | n | Source hosts |
|---|---|---|
| Office | 1538 | boxerproperty.com: 1401 (91%); mcalpineinterests.com: 88 (6%); bldgopttech.com: 45 (3%); expcommercial.com: 2 (0%); davis-commercial.com: 1 (0%); listings.newcorcre.com: 1 (0%) |
| Retail | 47 | mcalpineinterests.com: 24 (51%); realty1partners.com: 22 (47%); expcommercial.com: 1 (2%) |
| Industrial | 5 | warehouses4lease.com: 4 (80%); listings.newcorcre.com: 1 (20%) |
| Flex | 5 | northpark34.com: 3 (60%); realty1partners.com: 2 (40%) |
Cohorts that were not converted
USD per month, area not stated
These readings state a monthly rent and do not state an area, so they are not divided into a per-square-foot rate.
| Asset class | Median | n |
|---|---|---|
| Office | Not published | 3 |
USD per square foot, period not stated
The page stated a per-square-foot rent and did not say whether that was per year or per month. These readings are not mixed into the per-year median.
| Asset class | Median of the stated figure | n |
|---|---|---|
| Office | $20.50 per square foot, period not stated | 6 |
| Retail | Not published | 1 |
| Industrial | Not published | 1 |
| Flex | Not published | 1 |
Stated postal codes
A row is a postal code printed on the observation, not a named submarket. It is listed when at least 5 normalized readings share that code inside one asset class. A building that publishes many suites can move the figure. Groups below 5 stay in the class median and are left out of this table. When one stated postal code is more than 30% of a cohort, the composition warning above names that share.
| Asset class | Postal code | Median $/sf/yr | n |
|---|---|---|---|
| Office | 77074 | $19.24 | 302 |
| Office | 77036 | $16.40 | 294 |
| Office | 77060 | $16.69 | 150 |
| Office | 77058 | $25.43 | 91 |
| Office | 77478 | $20.99 | 80 |
| Office | 77040 | $19.44 | 78 |
| Office | 77063 | $17.84 | 74 |
| Office | 77042 | $24.09 | 67 |
| Office | 77002 | $21.99 | 57 |
| Office | 77339 | $21 | 51 |
| Office | 77027 | $24.16 | 48 |
| Office | 77014 | $14.03 | 45 |
| Office | 77057 | $24.27 | 30 |
| Office | 77092 | $16.75 | 23 |
| Office | 77477 | $13.24 | 18 |
| Office | 77082 | $18 | 17 |
| Retail | 77433 | $45 | 16 |
| Office | 77056 | $23.45 | 14 |
| Office | 77077 | $48 | 13 |
| Office | 77338 | $18 | 12 |
| Office | 77346 | $46.51 | 12 |
| Office | 77007 | $36.66 | 10 |
| Office | 77024 | $24.76 | 10 |
| Office | 77054 | $25.13 | 10 |
| Retail | 77339 | $15 | 10 |
| Office | 77008 | $31.38 | 7 |
| Office | 77018 | $31.13 | 6 |
| Office | 77070 | $21.39 | 6 |
| Office | 77098 | $34.01 | 5 |
| Office | 77380 | $31 | 5 |
Method
Observation window: 2026-09-01 through 2026-09-30, UTC. A date is the day a public page was read, not a lease start. Published readings in this window run from 2026-09-27 through 2026-09-28.
Each published suite contributes its newest observation in that window. An older reading on the same suite is not a second point.
3434 suites have a reading in the window. 1696 of those state a base rent with a unit. A null base rent is excluded from every median. Null does not mean zero.
0 duplicate readings were collapsed before the medians. A duplicate is the same address, suite label, rent, unit, and area. A blank address is not merged with another suite. The n under each median is the count after that collapse.
USD per square foot per year is the primary unit. A rent stored as $/SF/yr is used as stated. A rent stored as $/SF/mo is multiplied by 12. That is a unit conversion of a stated rate, not a new rent. A rent stored as $/month is converted only when area is stated and greater than zero: monthly rent times 12, divided by the stated square feet. A rent stored as $/year is divided by stated square feet the same way.
A rent stored as $/SF (period not stated) is not converted. The page did not say year or month. Those readings have their own median, labeled period not stated.
A monthly rent with no stated area stays in a USD-per-month median. It is not divided into a per-square-foot rate.
A stated amount with no stored unit is excluded from every median. The amount remains on the suite page. A non-positive rent is not used. This snapshot does not replace any excluded figure with an estimate.
788 stated rents remain outside every median after deduplication because the unit could not be used under those rules.
The printed min–max uses a plausibility band of $3 to $80 per square foot per year. A converted reading outside that band is omitted from the printed range. It stays in n and in the median. 4 citywide converted readings fall outside the band. No excluded figure is replaced with an estimate.
The median is the middle value after sorting. An even count uses the mean of the two middle values only. The arithmetic mean of the cohort is not published. A median is not published when n is below 5. The count is still printed. None is invented.
47 converted readings have no stated use type. They stay in the citywide median. They are not a headline asset class, they are not given a class page, and they are not moved onto office, retail, industrial, or flex.
When one stated postal code is more than 30% of a cohort, and that cohort has at least 5 converted readings, the snapshot prints a composition warning. The warning is a share of readings, not a submarket name.
This Greater Houston snapshot does not have a Zenodo DOI. The Fact Lease Zenodo deposit https://doi.org/10.5281/zenodo.22923838 holds San Antonio readings. It does not cover this snapshot.
Readings are suite observations, not buildings and not closed leases. Source type is Public web page. Evidence older than 7 days is Not re-read in 7+ days on the suite page. This snapshot does not drop a reading for age.
77354 is 17 of the 47 use type not stated readings (36%). One postal code is more than 30% of that cohort. This is not a balanced sample of use type not stated.
Caveats
These are asking rents printed on public pages, observed on the dates above. They are not closed transactions, not effective rents, and not a confirmation that the suite is available.
Rent units in the source pages are inconsistent. Some state dollars per month, some state dollars per square foot per year, and some state a per-square-foot figure without a period. This snapshot does not guess the missing period.
Listing headlines are not treated as building names on suite pages when the observation states an address. The medians do not depend on the headline.
One property with many suites can dominate a postal code. This is not a building-weighted index.
Plausibility band for the printed min–max: $3–$80 per square foot per year. 4 readings fall outside that band and are omitted from the printed range. Those readings stay in n and in the median.
Not an availability claim. Every reading is a dated public page, not a confirmation that a suite is available. Greater Houston lists the published suites. All snapshots. Methodology. A misread field is identified on corrections.